data science view markdown
Some notes on doing data science - visualization, messy data, feature selection, and reproducibility.
pqrs
- Goal: inference - conclusion or opinion formed from evidence
- PQRS
- P - population
- Q - question - 2 types
- hypothesis driven - does a new drug work
- discovery driven - find a drug that works
- R - representative data colleciton
- simple random sampling = SRS
- w/ replacement: $var(\bar{X}) = \sigma^2 / n$
- w/out replacement: $var(\bar{X}) = (1 - \frac{n}{N}) \sigma^2 / n$
- simple random sampling = SRS
- S - scrutinizing answers
visualization
First 5 parts here are based on the book storytelling with data by cole nussbaumer knaflic
- difference between showing data + storytelling with data
understand the context (1)
- who is your audience? what do you need them to know/do?
- exploratory vs explanatory analysis
- slides (need little details) vs email (needs lots of detail) - usually need to make both in slideument
- should know how much nonsupporting data to show
- distill things down into a 3-minute story or a 1-sentence Big Idea
- easiest to start things on paper/post-it notes
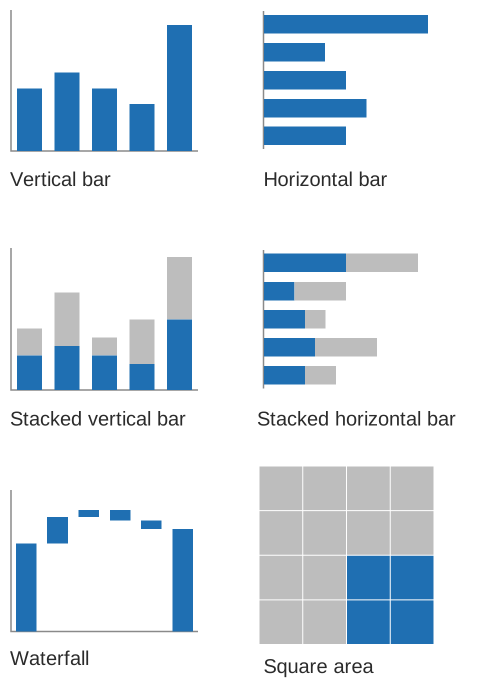
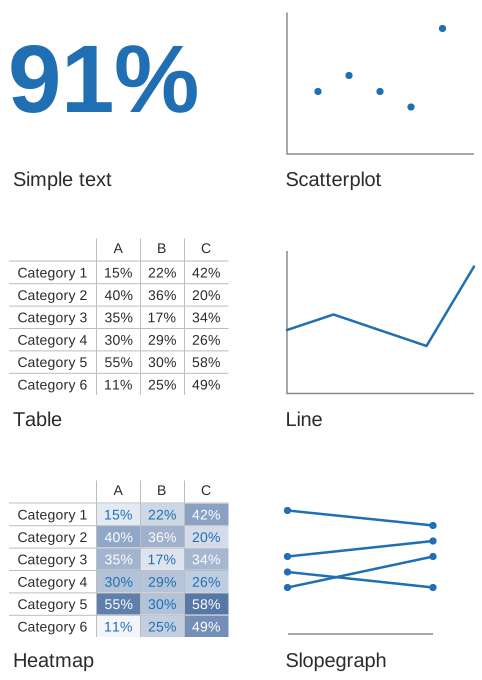
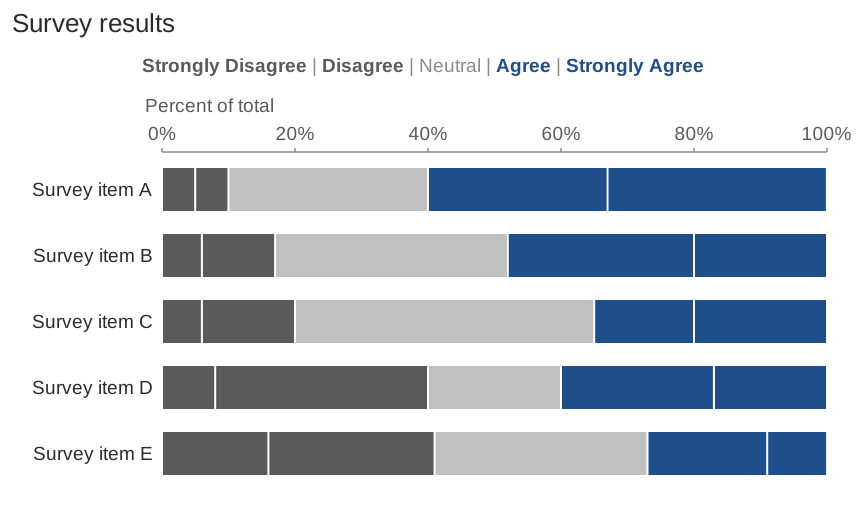
choose an effective visual (2)
 |
 |
|---|---|
 |
 |
 |
 |
 |
 |
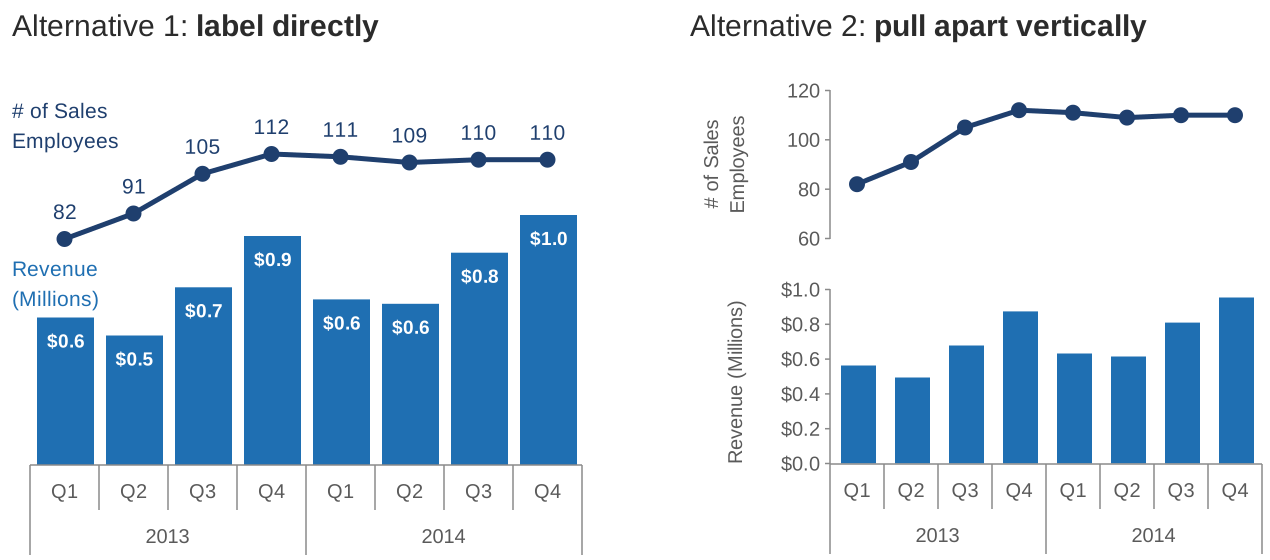
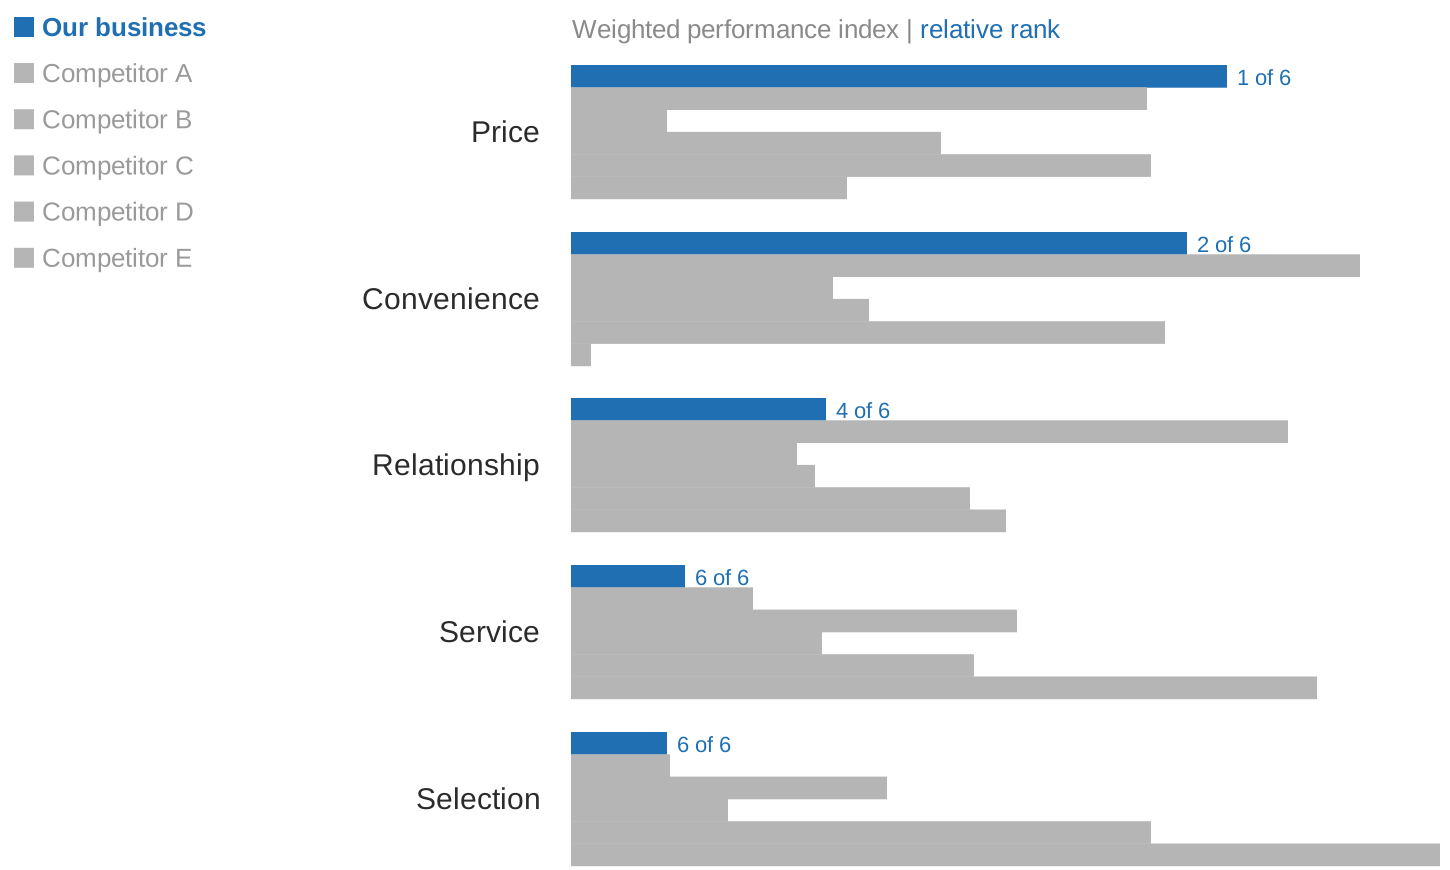
- generally avoid pie/donut charts, 3D charts, 2nd y-axes
- tables
- best for when people will actually read off numbers
- minimalist is best
- bar charts should basically always start at 0
- horizontal charts typically easy to read
- on axes, retain things like dollar signs, percent, etc.
eliminate clutter (3)
- gestalt principles of vision
- proximity - close things are grouped
- similarity - similar things are grouped
- connection - connected things are grouped
- enclosure
- closure
- continuity
- generally good to have titles and such at top-left!
- diagonal lines / text should be avoided
- center-aligned text should be avoided
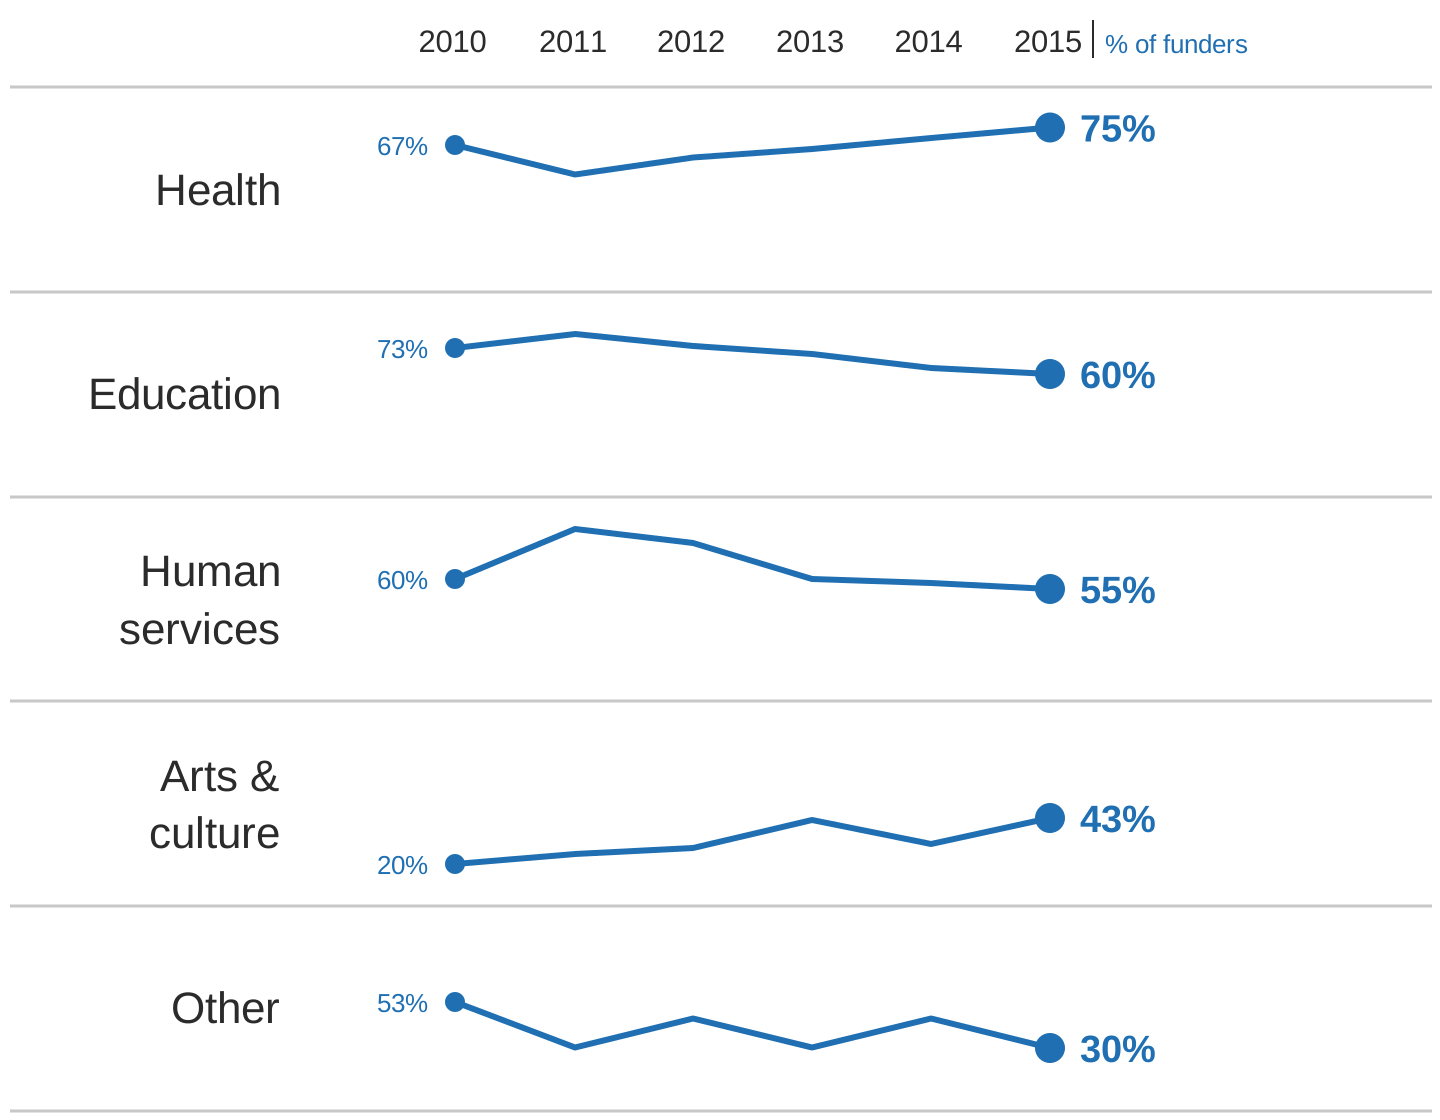
- label lines directly
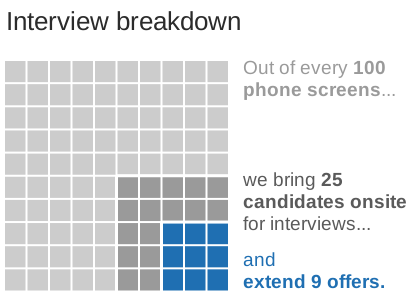
focus attention (4)
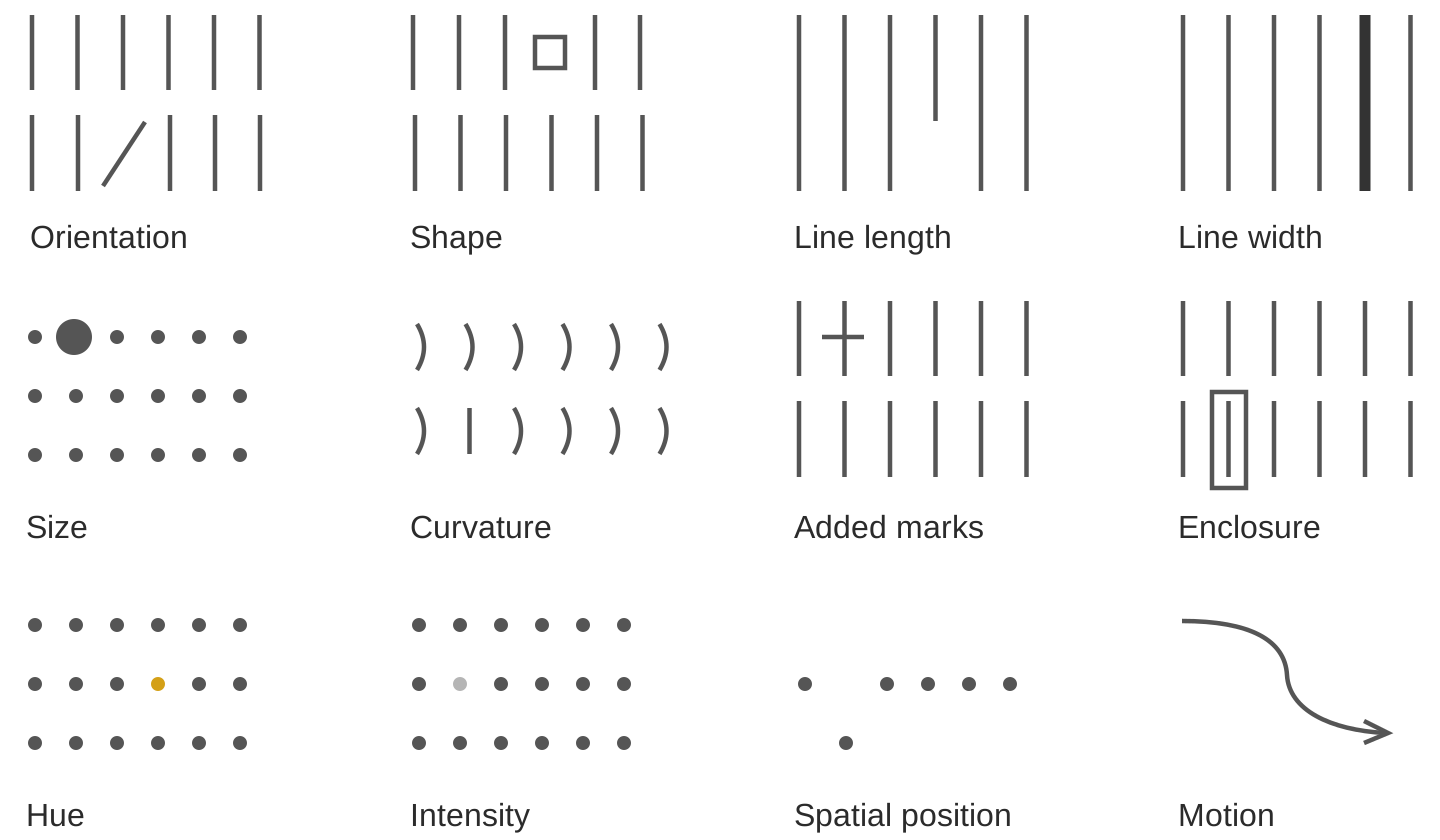
- visual hierarchy - outlines what is important
tell a story / think like a designer (5)
- affordances - aspects that make it obvious how something will be used (e.g. a button affords pushing)
- “You know you’ve achieved perfection, not when you have nothing more to add, but when you have nothing to take away” (Saint‐Exupery, 1943)
- stories have different parts, which include conflict + tension
- beginning - introduce a problem / promise
- middle - what could be
- end - call to action
- horizontal logic - people can just read title slides and get out what they need
- can either convince ppl through conventional rhetoric or through a story
visual summaries
- numerical summaries
- mean vs. median
- sd vs. iq range
- visual summaries
- histogram
- kernel density plot - Gaussian kernels
- with bandwidth h $K_h(t) = 1/h K(t/h)$
- plots
- box plot / pie-chart
- scatter plot / q-q plot
- q-q plot = probability plot - easily check normality
- plot percentiles of a data set against percentiles of a theoretical distr.
- should be straight line if they match
- transformations = feature engineering
- log/sqrt make long-tail data more centered and more normal
- delta-method - sets comparable bw (wrt variance) after log or sqrt transform: \(Var(g(X)) \approx [g'(\mu_X)]^2 Var(X)\) where $\mu_X = E(X)$
- if assumptions don’t work, sometimes we can transform data so they work
- transform x - if residuals generally normal and have constant variance
- corrects nonlinearity
- transform y - if relationship generally linear, but non-constant error variance
- stabilizes variance
- if both problems, try y first
- Box-Cox: Y’ = \(Y^l \: if \: l \neq 0\), else log(Y)
- least squares
- inversion of pxp matrix ~O(p^3)
- regression effect - things tend to the mean (ex. bball children are shorter)
- in high dims, l2 worked best
- kernel smoothing + lowess
- can find optimal bandwidth
- nadaraya-watson kernel smoother - locally weighted scatter plot smoothing
- \(g_h(x) = \frac{\sum K_h(x_i - x) y_i}{\sum K_h (x_i - x)}\) where h is bandwidth
- loess - multiple predictors / lowess - only 1 predictor
- also called local polynomial smoother - locally weighted polynomial
- take a window (span) around a point and fit weighted least squares line to that point
- replace the point with the prediction of the windowed line
- can use local polynomial fits rather than local linear fits
- silhouette plots - good clusters members are close to each other and far from other clustersf
- popular graphic method for K selection
- measure of separation between clusters $s(i) = \frac{\corange{b(i)} - \cblue{a(i)}}{\max(\cblue{a(i)}, \corange{b(i)})}$
- a(i) - ave dissimilarity of data point i with other points within same cluster
- b(i) - lowest average dissimilarity of point i to any other cluster
- good values of k maximize the average silhouette score
- lack-of-fit test - based on repeated Y values at same X values
imbalanced data
- randomly oversample minority class
- randomly undersample majority class
- weighting classes in the loss function - more efficient, but requires modifying model code
- generate synthetic minority class samples
- smote (chawla et al. 2002) - interpolate betwen points and their nearest neighbors (for minority class) - some heuristics for picking which points to interpolate
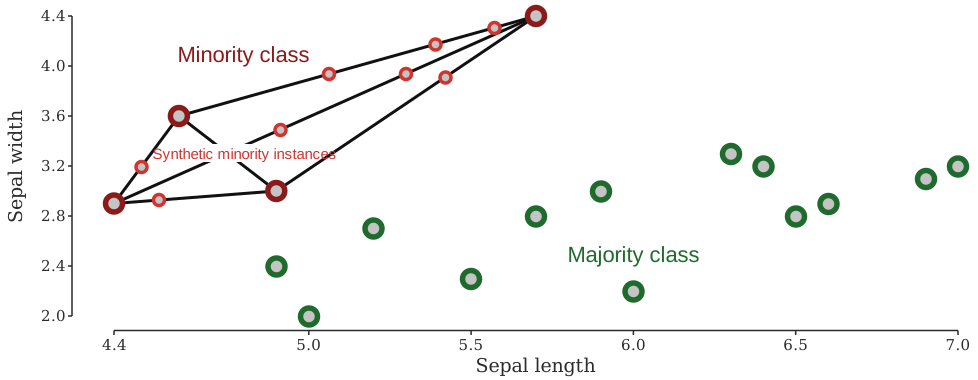
- adasyn (he et al. 2008) - smote, generate more synthetic data for minority examples which are harder to learn (number of samples is proportional to number of nearby samples in a different class)
- smrt - generate with vae
- smote (chawla et al. 2002) - interpolate betwen points and their nearest neighbors (for minority class) - some heuristics for picking which points to interpolate
- selectively removing majority class samples
- tomek links (tomek 1976) - selectively remove majority examples until al lminimally distanced nearest-neighbor pairs are of the same class
- near-miss (zhang & mani 2003) - select samples from the majority class which are close to the minority class. Example: select samples from the majority class for which the average distance of the N closest samples of a minority class is smallest
- edited nearest neighbors (wilson 1972) - “edit” the dataset by removing samples that don’t agree “enough” with their neighborhood
- feature selection and extraction
- minority class samples can be discarded as noise - removing irrelevant features can reduce this risk
- feature selection - select a subset of features and classify in this space
- feature extraction - extract new features and classify in this space
- ideas
- use majority class to find different low dimensions to investigate
- in this dim, do density estimation
- residuals - iteratively reweight these (like in boosting) to improve performance
- incorporate sampling / class-weighting into ensemble method (e.g. treat different trees differently)
- ex. undersampling + ensemble learning (e.g. IFME, Becca’s work)
- algorithmic classifier modifications
- misc papers
- enrichment (jegierski & saganowski 2019) - add samples from an external dataset
- ref
- imblanced-learn package with several methods for dealing with imbalanced data
- good blog post
- Learning from class-imbalanced data: Review of methods and applications (haixiang et al. 2017)
- sample majority class w/ density (to get best samples)
- log-spline - doesn’t scale
missing-data imputation
- Missing value imputation: a review and analysis of the literature (lin & tsai 2019)
- Causal Inference: A Missing Data Perspective (ding & li, 2018)
- different missingness mechanisms (little & rubin, 1987)
- MCAR = missing completely at random - no relationship between the missingness of the data and any values, observed or missing
- MAR = missing at random - propensity of missing values depends on observed data, but not the missing data
- can easily test for this vs MCAR
- MNAR = missing not at random - propensity of missing values depends both on observed and unobserved data
- connections to causal: MCAR is much like randomization, MAR like ignorability (although slightly more general), and MNAR like unmeasured unconfounding
- imputation problem: propensity of missing values depends on the unobserved values themselves (not ignorable)
- simplest approach: drop rows with missing vals
- mean/median imputation
- probabilistic approach
- EM approach, MCMC, GMM, sampling
- matrix completion: low-rank, PCA, SVD
- nearest-neighbor / matching: hot-deck
- (weighted) prediction approaches
- linear regr, LDA, naive bayes, regr. trees
- can do weighting using something similar to inverse propensities, although less common to check things like covariate balance
- multiple imputation: impute multiple times to get better estimates
- MICE (passes / imputes data multiple times sequentially)
- can perform sensitivity analysis to evaluate the assumption that things are not MNAR
- two standard models for nonignorable missing data are the selection models and the pattern-mixture models (Little and Rubin, 2002, Chapter 15)
- performance evaluation
- acc at finding missing vals
- acc in downstream task
- applications
- Purposeful Variable Selection and Stratification to Impute Missing FAST Data in Trauma Research (fuchs et al. 2014)
matrix completion
- A Survey on Matrix Completion: Perspective of Signal Processing (li…zhao, 2019)
- formulations
- Exact matrix completion via convex optimization (candes & recht, 2012)
- \(\min _{\boldsymbol{M}} \operatorname{rank}(\boldsymbol{M})\), s.t. \(\left\vert \boldsymbol{M}_{\Omega}-\boldsymbol{X}_{\Omega}\right\vert _F \leq \delta\): - this is NP-hard
- nuclear norm approxmiation
- \(\min _{\boldsymbol{M}}\vert \boldsymbol{M}\vert _*\), s.t. \(\vert \vert \boldsymbol{M}_{\Omega}-\boldsymbol{X}_{\Omega}\vert \vert _F \leq \delta\)
- this has be formulated as semidefinite programming, nuclear norm relaxation, or robust PCA
- minimum rank approximation helps with the assumption that the data are corrupted by noise (e.g. ADMiRA (lee & bresler, 2010))
- \(\min _{\boldsymbol{M}}\left\vert (\boldsymbol{M})_{\Omega}-\boldsymbol{X}_{\Omega}\right\vert _F^2\), s.t. $\operatorname{rank}(\boldsymbol{M}) \leq r$
- matrix factorization is a faster but non-convex approximation (e.g. LMaFit (wen, yin, & zhang, 2012))
- \(\min _{\boldsymbol{U}, \boldsymbol{V}, \boldsymbol{Z}}\left\vert \boldsymbol{U} \boldsymbol{V}^T-\boldsymbol{Z}\right\vert _F^2\), s.t. \(\boldsymbol{Z}_{\Omega}=\boldsymbol{X}_{\Omega}\)
- $\ell_p$-Norm minimization - use a different norm than Frobenius to handle specific types of noise
- Adaptive outlier pruning (yan, yang, & osher, 2013) - better handles outliers
- Exact matrix completion via convex optimization (candes & recht, 2012)
- algorithms
- gradient-based
- gradient descent
- accelerated proximal descent
- bregman iteration
- non-gradient
- block coordinate descent
- ADMM: alterntating direction method of multipliers
- gradient-based
- formulations
- Newer approaches
- Simple, Fast, and Flexible Framework for Matrix Completion with Infinite Width Neural Networks (radhakrishnan…belkin, uhler, 2022) - use NTK for FCN/CNN to do matrix completion
- Graph Convolutional Matrix Completion (van den berg, kipf, & welling, 2017)
- Transformer methods for image inpainting (e.g. mask-aware tranfsormer, 2022)
preprocessing
- often good to discretize/binarize features
- e.g. from genomics
- whitening
- get decorrelated features $Z$ from inputs $X$
- $W=$ whitening matrix, selected based on problem goals:
- PCA: Maximal compression of $\mathbf{X}$ in $\mathbf{Z}$
- ZCA: Maximal similarity between $\mathbf{X}$ and $\mathbf{Z}$
- Cholesky: Inducing structure: $\operatorname{Cov}(X, Z)$ is lower-triangular with positive diagonal elements
- $W$ is constrained as to enforce $\Sigma_{Z}=I$
- PCA: Maximal compression of $\mathbf{X}$ in $\mathbf{Z}$
feature selection
filtering - select based on summary statistic
- ranks features or feature subsets independently of the predictor
- univariate methods (consider one variable at a time)
- ex. variance threshold
- ex. T-test of y for each variable
- ex. correlation screening: pearson correlation coefficient - this can only capture linear dependencies
- mutual information - covers all dependencies
- ex. chi$^2$, f anova
- multivariate methods
- features subset selection
- need a scoring function
- need a strategy to search the space
- sometimes used as preprocessing for other methods
wrapper - recursively eliminate features
- uses a predictor to assess features of feature subsets
- learner is considered a black-box - use train, validate, test set
- forward selection - start with nothing and keep adding
- backward elimination - start with all and keep removing
- others: Beam search - keep k best path at teach step, GSFS, PTA(l,r), floating search - SFS then SBS
embedding - select from a model
- uses a predictor to build a model with a subset of features that are internally selected
- ex. lasso, ridge regression, random forest
reproducibility
containerization
- e.g. docker
data version control
- dvc - data version control
- .dvc folder keeps track of some internal stuff (like .git)
- metafiles ending with .dvc are stored in git, tracking big things like data and models
- also simple support for keeping track of metrics, displaying pipeline, making plots
- keep track of old things using git checkout and dvc checkout
- dagshub - built on dvc, like github (gives ~10GB free storage per project)
- “Our recommendation is to separate distinct experiments (for example, different types of models) into separate branches, while smaller changes between runs (for example, changing model parameters) are consecutive commits on the same branch.”
- not open source :frowning_face:
- replicate.ai - version control for ml
- lightweight, focuses on tracking model weights / sharing + dependencies
- less about hyperparams
- mlflow (open-source) from databricks
- API and UI for logging parameters, code versions, metrics and output files
- clear-ml
- gigantum - like a closed-source dagshub
- codalab - good framework for reproducibility
- paid / closed-source
- weights and biases (free for academics, paid otherwise)
- neptune.ai
- h20 ai (source here)
hyperparameter tuning
- weaker versions
- tensorboard (mainly for deep learning)
- pytorch-lightning + hydra
- ray
weights and biases
wandb.login()- login to W&B at the start of your sessionwandb.init()- initialise a new W&B, returns a “run” objectwandb.log()- logs whatever you’d like to log
workflow management
- prefect
- tasks are basically functions
- flows are used to describe the dependencies between tasks, such as their order or how they pass data around
principles
breiman
- conversation
- moved sf -> la -> caltech (physics) -> columbia (math) -> berkeley (math)
- info theory + gambling
- CART, ace, and prob book, bagging
- ucla prof., then consultant, then founded stat computing at berkeley
- lots of cool outside activities
- ex. selling ice in mexico
- 2 cultures paper
- generative - data are generated by a given stochastic model
- stat does this too much and needs to move to 2
- ex. assume y = f(x, noise, parameters)
- validation: goodness-of-fit and residuals
- predictive - use algorithmic model and data mechanism unknown
- assume nothing about x and y
- ex. generate P(x, y) with neural net
- validation: prediction accuracy
- axioms
- Occam
- Rashomon - lots of different good models, which explains best?
- ex. rf is not robust at all
- Bellman - curse of dimensionality
- might actually want to increase dimensionality (ex. svms embedded in higher dimension)
- industry was problem-solving, academia had too much culture
- generative - data are generated by a given stochastic model
box + tukey
- questions
- what points are relevant and irrelevant today in both papers?
- relevant
- box
- thoughts on scientific method
- solns should be simple
- necessity for developing experimental design
- flaws (cookbookery, mathematistry)
- tukey
- separating data analysis and stats
- all models have flaws
- no best models
- lots of goold old techniques (e.g. LSR)
- box
- irrelevant
- some of the data techniques (I think)
- tukey multiple-response data has been better attacked (graphical models)
- relevant
- how do you think the personal traits of Tukey and Box relate to the scientific opinions expressed in their papers?
- probably both pretty critical of the science at the time
- box - great respect for Fisher
- both very curious in different fields of science
- what is the most valuable msg that you get from each paper?
- box - data analysis is a science
- tukey - models must be useful
- no best models
- find data that is useful
- no best models
- what points are relevant and irrelevant today in both papers?
- box_79 “science and statistics”
- scientific method - iteration between theory and practice
- learning - discrepancy between theory and practice
- solns should be simple
- fisher - founder of statistics (early 1900s)
- couples math with applications
- data analysis - subiteration between tentative model and tentative analysis
- develops experimental design
- flaws
- cookbookery - forcing all problems into 1 or 2 routine techniques
- mathematistry - development of theory for theory’s sake
- scientific method - iteration between theory and practice
- tukey_62 “the future of data analysis”
- general considerations
- data analysis - different from statistics, is a science
- lots of techniques are very old (LS - Gauss, 1803)
- all models have flaws
- no best models
- must teach multiple data analysis methods
- spotty data - lots of irregularly non-constant variability
- could just trim highest and lowest values
- winzorizing - replace suspect values with closest values that aren’t
- must decide when to use new techniques, even when not fully understood
- want some automation
- FUNOP - fulll normal plot
- can be visualized in table
- could just trim highest and lowest values
- spotty data in more complex situations
- FUNOR-FUNOM
- multiple-response data
- understudied except for factor analysis
- multiple-response procedures have been modeled upon how early single-response procedures were supposed to have been used, rather than upon how they were in fact used
- factor analysis
- reduce dimensionality with new coordinates
- rotate to find meaningful coordinates
- can use multiple regression factors as one factor if they are very correlated
- regression techniques always offer hopes of learning more from less data than do variance-component techniques
- flexibility of attack
- ex. what unit to measure in
- general considerations
models
- normative - fully interpretable + modelled
- idealized
- probablistic
- ~mechanistic - somewhere in between
- descriptive - based on reality
- empirical
exaggerated claims
- video by Rob Kass
- concepts are ambiguous and have many mathematical instantiations
- e.g. “central tendency” can be mean or median
- e.g. “information” can be mutual info (reduction in entropy) or squared correlation (reduction in variance)
- e.g. measuring socioeconomic status and controlling for it
- regression “when controlling for another variable” makes causal assumptions
- must make sure that everything that could confound is controlled for
- Idan Segev: “modeling is the lie that reveals the truth”
- picasso: “art is the lie that reveals the truth”
- box: “all models are wrong but some are useful” - statistical pragmatism
- moves from true to useful - less emphasis on truth
- “truth” is contingent on the purposes to which it will be put
- the scientific method aims to provide explanatory models (theories) by collecting and analyzing data, according to protocols, so that
- the data provide info about models
- replication is possible
- the models become increasingly accurate
- scientific knowledge is always uncertain - depends on scientific method